Wednesday, July 29, 2015

Lab 7: Flame Test Lab

In this lab, we had to burn different compounds over a flame with a wooden stick and observe the color of light emitted.  We then used those recordings to identify two mystery chlorine compounds in the end.

Pre-Lab Questions:

1.  The ground state is the normal electron configuration of atoms or ions of an element, whereas the excited state is when atoms or ions in the ground state are heated to high temperatures and some electrons absorb energy and "jump" to a higher energy level.

2.  The word "emit" means to release.  Electrons emit light in the form of electromagnetic radiation as they return to ground state.

3.  In this experiment, the atoms are getting their excess energy from the bunsen burner flame, since the atoms are being heated at high temperatures, causing the electrons to absorb energy and jump to higher energy levels.

4.  Different atoms emit different colors of light because each atom will produce only one color (each atom is quantized).  Different atoms also have different electrons, and those electrons could jump to different energy levels, creating different colors.

5.  It's necessary to clean the nichrome wires (or, in this experiment, use a different stick each time) between each flame test to ensure that different compounds don't mix.


Unknown #1 was lithium chloride (LiCl) and unknown #2 was potassium chloride (KCl).  We found this because we compared the color burned to the other eight recorded color observations.  Unknown #1 burned a magenta color, shown above, which matched LiCl, and unknown #2 burned a light purplish color, which matched KCl.

Tuesday, July 28, 2015

Lab 8: Electron Configuration Battleship

The aftermath of Battleship with my partner Rachel
The biggest challenge I had while playing was naming the right electron configurations, especially in the f block and elements with exceptions.  As we continued playing, this became easier, and I felt more comfortable with naming the electron configurations using the noble gas shortcut in the end.

Monday, July 27, 2015

Lab 6: Mole-Mass Relationships

The purpose of this lab was to practice calculating theoretical yield and percent yield using the experimental data of a reaction of sodium bicarbonate and hydrochloric acid.  We also had to find the limiting reactant using the reaction NaHCO3 + HCl --> NaCl + CO2 + H2O by looking at the relationship of the reactants and products (how much product each reactant yielded).

Questions 1-4:


Our percent yield is lower than 100% most likely because some salt popped out during boiling or we didn't wait long enough for all the water to evaporate before weighing the dish.

The remaining solid in the evaporating dish after boiling.  The salt is a bluish color because the same dish
 was used in the copper sulfate hydrate lab, and the dish was probably not cleaned very well after use. It was
also interesting that the tongs left a yellow-greenish mark on the salt.


Friday, July 24, 2015

Lab 5B: Composition of a Copper Sulfate Hydrate Lab

Hydrate before heating:


Hydrate after heating:


Calculations for Questions 1-4


Question 5: The empirical formula we calculated for the hydrate was CuSO· 4 H2O.  We predict that the coefficient for H2O will be slightly smaller, if not equal to the actual value since our percent error was so small (8.3%).


Lab 5A: Mole Baggie Lab

The purpose of this lab was to identify a mystery substance in a plastic baggie given only the mass of the empty bag and the number of moles/particles.  We determined the identity of the substance by first weighing the bag on the scale to find the total mass, and then subtracted the mass of the empty bag from that, which gave us the substance mass.  Afterwards, we calculated the molar mass by dividing the substance mass (in grams) by the number of moles in the substance.  For Set B, we were given the number of particles instead of moles, so we just converted it into moles and plugged that into the molar mass equation.  Finally, we matched the calculated answer with one of the given possible compounds using the periodic table.

Bag A4 contained calcium carbonate, and bag B3 contained potassium sulfate.

Thursday, July 23, 2015

Lab 4A: Double Replacement Reaction Lab


Well plates after the reactions.  Plates 2-7 show
chemical reactions in which a solid precipitate formed.

Balanced chemical reactions #1-5 with net ionic equations

Balanced chemical reactions #6-10 with net ionic equations

The most surprising part of this lab was how easy writing the net ionic equations turned out to be.  I expected it to be more complicated, but taking the shortcut presented in class instead of writing out the complete ionic equations was a lot quicker and more convenient.  The most challenging part was looking up if certain compounds were aqueous or solid using the solubility rules.

Wednesday, July 22, 2015

Lab 3: Nomenclature Puzzle

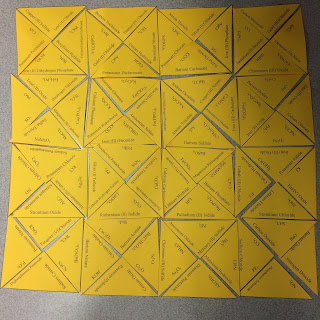
The goal of this activity was to solve a binary and polyatomic ions puzzle by matching the ion formula to their name, using our newly learned knowledge of chemistry nomenclature!  The biggest challenge we encountered was combining the pairs of triangles to form bigger squares and chains.  This puzzle wouldn't have been possible without organization and teamwork, so I think my biggest contributions were helping separate the squares into categories of certain elements, combining single squares at the very beginning, and also looking up certain unknown ions in the lab book.

Our finished puzzle!

Tuesday, July 21, 2015

Lab 2B: Atomic Mass of Candium

Candium's three isotopes - M&Ms!

The purpose of this lab was to plan and implement a procedure to determine the average atomic mass of the element candium, given a random sample of three different isotopes of the element: regular M&Ms, peanut M&Ms, and pretzel M&Ms.

Average atomic mass: 1.43 g

1.  Ask a group nearby what their average atomic mass was.  Why would your average atomic mass be different than theirs?

Another group's calculated atomic mass was 1.52 g.  Ours is different because each group received different amounts of isotopes (type of M&M) and different total amount and weight.  The sample sizes were also not very big, leading to more variation.

2.  If larger samples of candium were used, would the differences between your average atomic mass and others' average atomic masses be bigger or smaller?

The differences would be smaller, because the larger the sample, the closer the calculated masses will be to the average value as a result of less variation.

3.  If you took any piece of candium from your sample and placed it on the balance, would it have the exact average atomic mass that you calculated?  Why or why not?

No, because the calculated atomic mass is just an average and isn't necessarily the same value, but should be close.  It would be extremely rare for a random candium sample to be exactly the same as the average atomic mass.

4.  Periodic table square for candium!


Lab 2A: Chromatography Lab


Before:


After:


My partner Meghana and I with our two favorite chromatograms!

Questions:

1)  Why is it important that only the wick and not the filter paper circles be in contact with the water in the cup?

It's important that the filter paper isn't entirely saturated at first so the water can seep through the wick and slowly onto the paper, which then gives the ink time to spread out from the center and separate into the different pigments.

2)  What are some of the variables that will affect the pattern of colors produced on the filter paper?

Some variables include the type of pen used (since different inks are composed of different colors), the pattern drawn using the pens, the distance the pattern was drawn from the center, the amount of ink used, and the length of the wick.

3)  Why does each ink separate into different pigment bands?

Each ink has different mixtures and will travel up the paper at different rates depending on their characteristic physical properties.  Some components in the mixture are more strongly adsorbed onto the paper than others, and those will move up the paper more slowly than the solvent.  Components that are not strongly adsorbed onto the paper will move up the paper more slowly than the solvent.  This "partitioning" of the components of the mixture between the paper and the solvent separates the components and creates different pigment bands.

4)  Choose one color that is present in more than one type of ink.  Is the pigment that gives this color always the same?  Do any of the pens appear to contain common pigments?  Explain.

Blue is one color that is present in both chromatograms, and the pigment that gives this color is always the same, since blue is used in the ink of many types of pens and markers.  Many of the pens appear to contain common pigments besides blue, such as yellow, orange, pink, and a bit of violet.  The order that the colors show up from the circle is also similar on both papers -- yellow, orange, and pink (warmer colors) are near the center, and blue, the cooler color, is on the outer side.

5)  Why are only water-soluble markers or pens used in this activity?  How could the experiment be modified to separate the pigments in "permanent" markers or pens?

Only water-soluble pens were used so that water could cause the ink to spread across the filter paper.  The experiment could be modified to separate the pigments in permanent markers by using a solvent, for example, rubbing alcohol, that is able to "remove" or separate permanent markers.

Monday, July 20, 2015

Lab 1B: Aluminum Foil Lab

Part II: Determining the Thickness of Aluminum Foil

Procedure:

To find the thickness of a piece of aluminum foil, we first used the formula for volume: V = L x H x W.  We measured the length (15.50 cm) and width (8.13 cm) of the foil, leaving the height H (thickness) as the variable to solve for.  For the volume of the foil, we used the expression 15.50 x 8.13 x H (126 x H).  The next step was to find the mass and density to plug into the formula D=M/V.  We calculated the mass, which was 0.48 grams, by weighing the foil on the scale.  We then determined the density by referring to the given density of aluminum from Part I of the lab, which was 2.8 g/cm3.  By plugging these three values into D=M/V, we obtained:


Finally, we solved for H and rounded to two significant figures, which was 0.0014 cm.  We converted that to millimeters by multiplying it by ten and obtained our final answer for the thickness of aluminum foil, 0.014 mm.


Lab 1A: Density Block Lab

Introduction:

The purpose of this lab is to determine the mass of a plastic block using its density and volume.  My partner and I calculated the mass of the block using the calculated volume and the given density of the block.  Afterwards, we found the actual mass by weighing the block on a scale, and calculated the percent error using the percent error formula.  Important terms include density (mass per unit volume of an object), mass (the amount of matter in an object), and volume (the amount of space an object occupies).

Procedure:  

First, we used a ruler to carefully measure each side of the plastic block --- length, width, and height.  We then calculated the volume by multiplying the three numbers.  Afterwards, we plugged the volume and density of the block (which was already given to us) into the D=M/V equation to find the mass.  To determine whether our calculation was accurate or not, we weighed the block on a scale. Finally, using the percent error formula, ((actual - experiment)/actual) x 100%, we found the percent error.

Data:  

Block:
  • height - 1.25 cm
  • length - 9.33 cm
  • width - 6.82 cm
Volume: 82.1 cm^3

On our first try, we calculated the mass to be 44.4 grams using the D=M/V formula.  82.1 cm^3 was the volume, and the given density was 0.541 g/cm^3.  The block was actually 44.5 grams, leaving a percent error of 0.225%.

Conclusion: 

We successfully fulfilled the purpose of the lab on our first try.  We learned that we had to be very precise when measuring objects with a ruler, and some sources of error include inaccuracy with measuring and rounding to significant figures.  In the future, to prevent the same errors and improve the accuracy of our results, we would need to pay closer attention to significant figures and rounding.